In this guide, we’ll introduce you to the Business Performance Analytics feature, show you the valuable insights it provides, and explain how you can use this data to strengthen your product options and maximize your store’s revenue.
The Business Performance tab gives you revenue, volume, and best-seller insights for every order that contains Easify options, all in one place.
✨ The Real-time Analytics is available on all plans while the Orders list is available from the Pro plan.
However, users on the Free plan won’t have access to add-on features, meaning the related analytics for add-ons will be unavailable. Despite this, free plan users can still benefit from tracking how non-priced options impact total revenue and order numbers.
To unlock the full potential of the analytics and maximize your store’s performance, we recommend upgrading to a higher plan, which provides deeper insights into how both priced and non-priced options are boosting your revenue.
Analytics on the Dashboard #
What can you track?
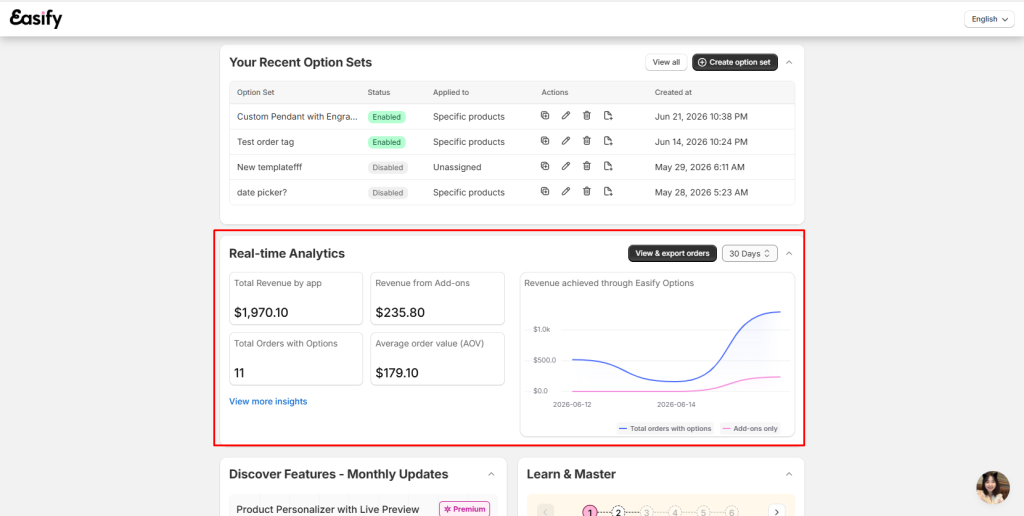
On the Dashboard, you’ll find a Real-time Analytics section, offering key performance indicators presented with a helpful line chart:
- Total Revenue by app: The total revenue from all orders that include Easify options, including both priced (add-ons) and non-priced options.
- Revenue from Add-ons: This metric focuses solely on the revenue generated from paid add-ons (options with an extra price).
- Total Orders with Options: The total number of orders that include Easify product options, whether priced or non-priced.
- Line Chart: You can view your revenue trends over various time periods – All time, 1 day, 7 days, 30 days, or a custom range. The chart displays:
- Blue Line: Revenue from all orders that include Easify options.
- Pink Line: Revenue generated specifically from paid add-on products.
How does this help?
This section gives you an at-a-glance overview of how much your product options are contributing to your store’s overall performance.
- Total Revenue by app: This metric reflects the overall contribution of your custom options to your store’s success. While non-priced options may not directly add to revenue, they enhance customer choice, which can lead to larger orders, improved customer satisfaction, and higher conversion rates.
- Revenue from Add-ons: This figure lets you track the specific contribution of your paid options. If this number is increasing, it’s a strong indication that your priced options are effectively driving higher order values.
- Total Orders with Options: A high count here shows that your custom options, whether free or paid, are adding value to the shopping experience. This suggests your customers find the customization options appealing, which may lead to more completed purchases.
Business Performance in Orders page #
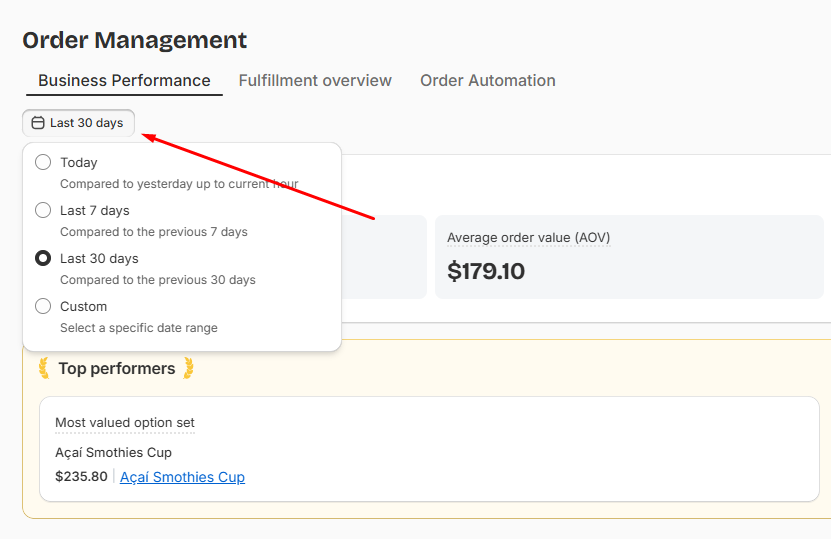
Setting the Date Range #
At the top of the tab, pick Today, Last 7 days, Last 30 days, or a Custom range. Every sales performance card, charts, and the order list below all update together based on your selection.
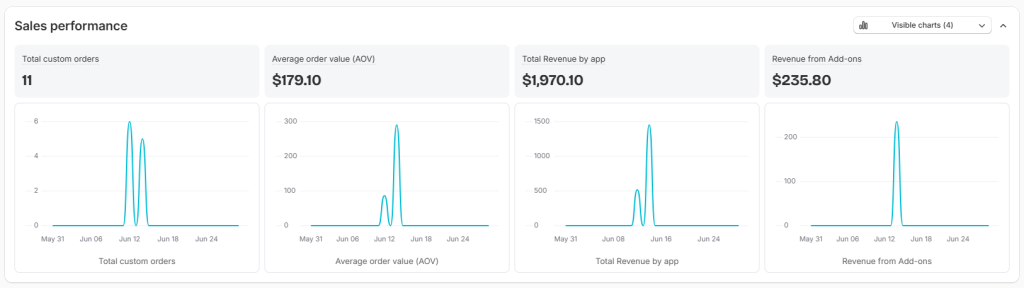
Sale Performance cards #
The Orders page provides additional useful statistics, some of which are also available on the Dashboard, but with extra insights:
- Total custom orders: Same as on the Dashboard, this shows how many orders include Easify product options.
- Average Order Value (AOV): The average value of all orders that include Easify options.
- Total Revenue by app: Also similar to the Dashboard, this tracks revenue from all orders with options.
- Revenue from Add-ons: Again, similar to the Dashboard, this shows revenue from paid add-on options.
📝 Note:
- Click any sales performance card to open a detailed line chart showing that metric day by day across your selected range.
- Hovering over a point on any chart shows the exact figure for that day.
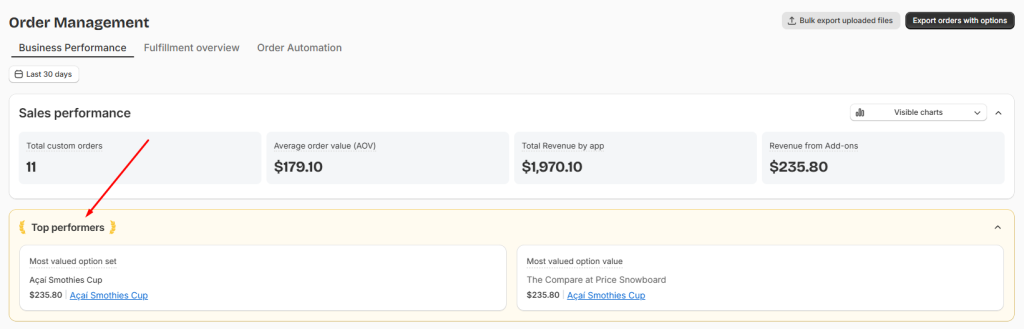
Top Performers #
- Most Valuable Option Set: The option set that has generated the highest total revenue for your store. You can also see the total revenue for this option set.
- Most Valuable Option Value: The individual option value that has brought in the most revenue. This includes details about which Option Set this option value belongs to, as well as the total revenue it has generated.
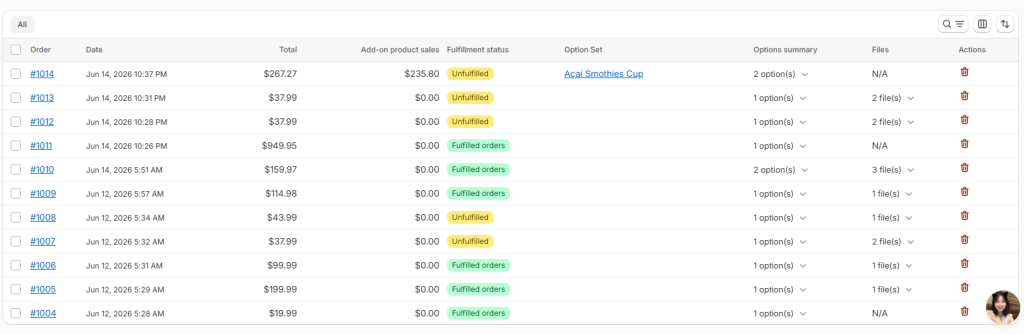
Checking the Orders Behind the Numbers #
Below the KPIs, you’ll find the same order list used throughout the Fulfillment Hub, already filtered to match your selected date range. For everything you can do there — searching, filtering, columns, and exporting — check out our View and Export Orders & Files guide.
Best Practices for you #
These metrics aren’t just for tracking — they can guide real decisions about your options strategy. Here’s how to put them to use:
- Assess how much options are driving your revenue. Compare Total Revenue by App against Revenue from Add-ons to see what share of your income comes from paid options. If add-ons make up a meaningful chunk, it’s worth investing more in attractive add-on choices.
- Spot your strongest sales periods. Switch between date ranges to find spikes or dips, then connect them back to campaigns, seasonal trends, or product launches. Use what you find to time future promotions.
- Gauge how much customers value customization. A high Total Custom Orders count relative to your overall order volume signals that customers actively want customization — a good reason to expand your options rather than scale them back.
- Watch the revenue trend line for the bigger picture. A steady upward or downward pattern in the Total Revenue by App chart can point you toward what’s working (or what needs a second look) before a single bad week becomes a habit.
- Check whether options are lifting order value. Compare AOV for orders with Easify options against your store’s overall AOV. If orders with options consistently run higher, your options are already doing real work increasing the value of each sale.
- Let your top performers guide the rest. Most Valued Option Set and Most Valued Option Value show you exactly what customers are choosing most. Use that insight to refine underperforming options, or build new products and promotions around what’s already resonating.
📝 Pro tip: To see whether your custom options are actually moving the needle, compare your current performance against a period before you added them — or compare orders with options to orders without. Either comparison gives you a clearer read than looking at the numbers in isolation.
Need Assistance? #
If you have any questions about navigating the analytics or need help understanding how to use this data to grow your store, don’t hesitate to reach out! Our support team is available via the in-app live chat to assist you.