Know what needs your attention the moment you open the page. The Fulfillment Snapshot tab gives you a real-time read on your current custom order workload — what’s open, what’s overdue, and what’s been flagged — so you can decide what to work on first instead of scrolling through a long order list to find it.
✨ The Fulfillment Snapshot analytics is available on all plans.
The order list requires the Pro plan and above.
Why the Fulfillment Snapshot Matters #
✅ Spot Overdue Orders Before Customers Do Orders sitting past your fulfillment threshold are surfaced automatically, so nothing quietly slips past your usual turnaround time.
🛒 Jump Straight to What Matters Every card and chart is clickable — click once and the order list below filters itself, no manual searching required.
🎨 Track Your Fulfillment Speed Over Time Avg Fulfillment Time and the Order to Fulfillment Time chart show you whether you’re keeping pace, or whether orders are starting to pile up.
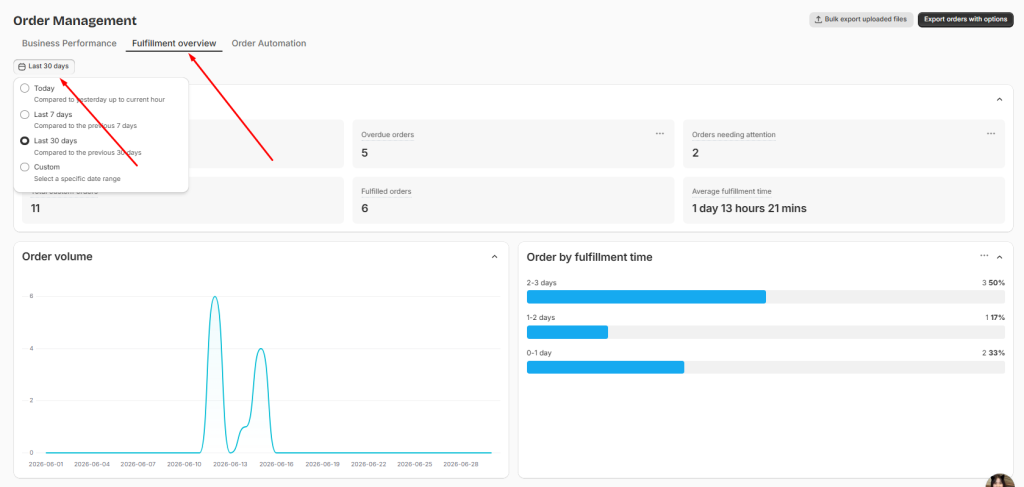
Setting the Date Range #
At the top of the tab, choose Today, Last 7 days, Last 30 days, or a Custom range. All fulfillment overview cards, charts, and the order list below update together based on your selection.
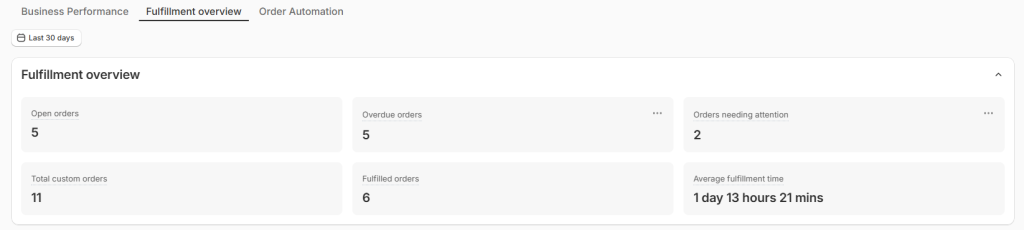
Fulfilment Overview #
Six cards give you a quick read on your current fulfillment status:
- Open Orders — orders that are Unfulfilled or Partially fulfilled right now.
- Overdue Orders — Unfulfilled orders older than your overdue threshold (default 3 days — you can adjust this).
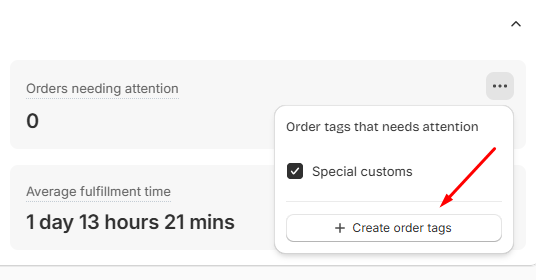
- Orders Needing Attention — orders carrying at least one order tag you’ve marked as “Needs attention.”
- Total Custom Orders — orders with Easify options created in your selected range.
- Orders Fulfilled — orders fulfilled within your selected range.
- Avg Fulfillment Time — the average time from order creation to fulfillment, shown as days, hours, and minutes.
📝 Note:
- Click any card to instantly filter the order list below to match — for example, clicking Overdue Orders filters to Unfulfilled orders past your threshold.
- Orders Needing Attention relies on order tags you’ve created and marked as “Needs attention.” If you haven’t created any tags yet, this card shows N/A. Learn how in our Order Automation guide.
Charts #
Two charts help you read trends at a glance:
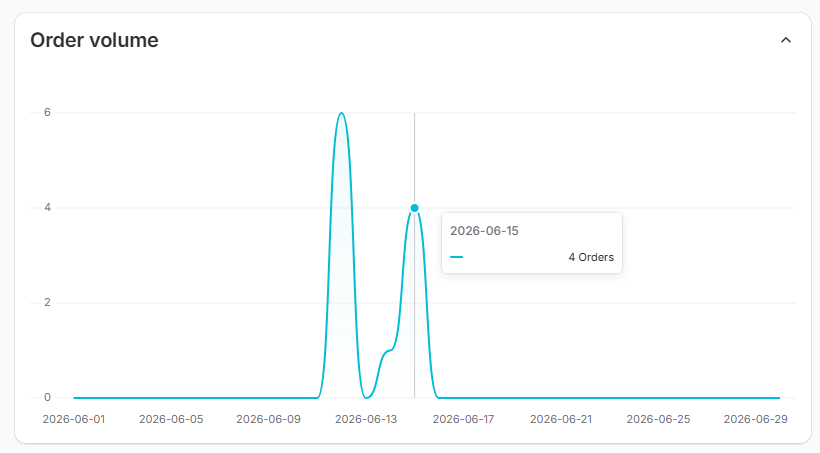
Order Volume — a line chart of how many custom orders came in each day across your range. Hover any point to see the exact count for that day.
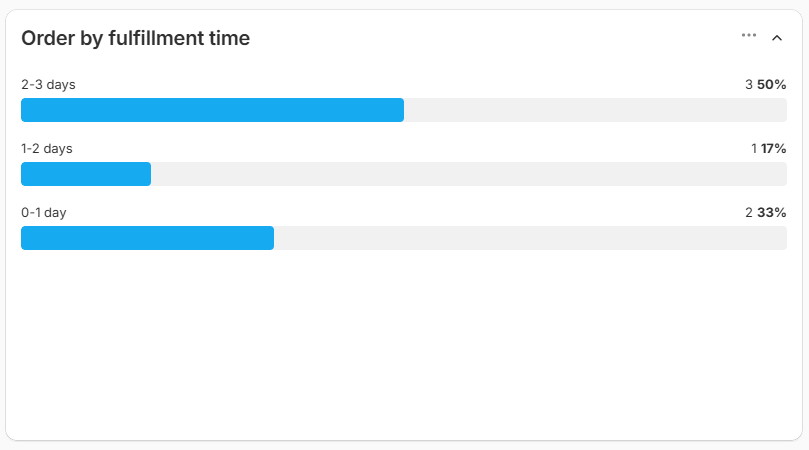
Order to Fulfillment Time — a bar chart showing how many of your fulfilled orders fell into each time bucket (for example, 0–1 day, 2–3 days, 4–7 days, more than 7 days). Each bar shows the order count and percentage, so you can see at a glance whether most of your orders are fulfilled quickly or whether a chunk are slipping past a week.
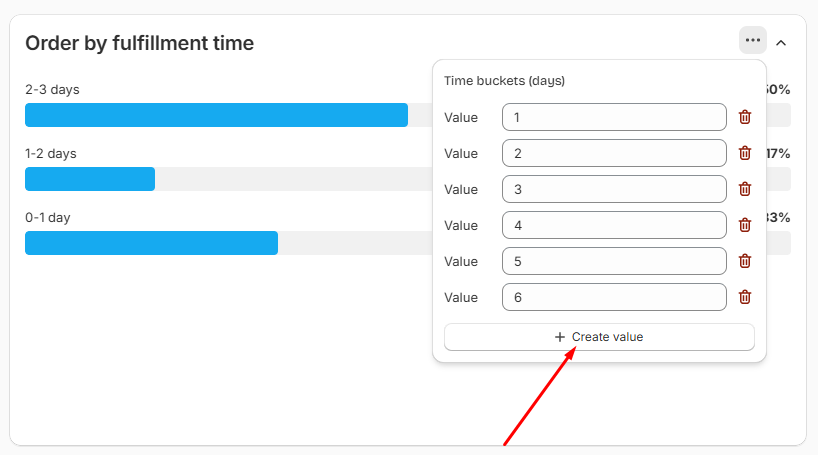
📝 Note: You can customize the time buckets to match your own fulfillment goals. Enter your own day thresholds (for example, 1, 3, 7) and save — the chart will regroup fulfilled orders into the new buckets.
Checking the Orders Behind the Numbers #
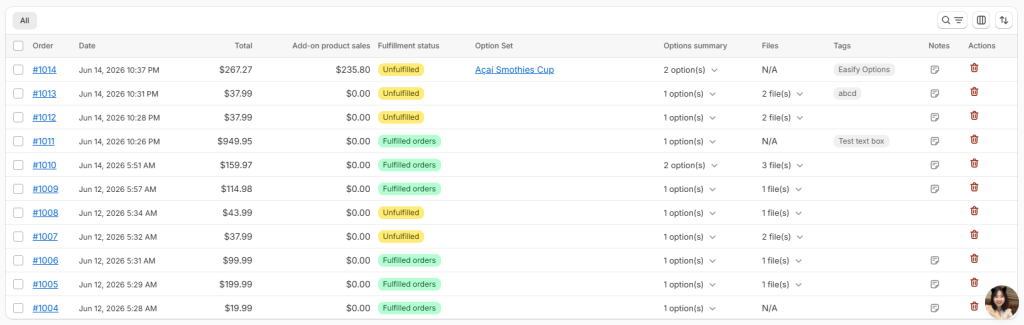
Below the charts, you’ll find the same order list used throughout the Fulfillment Hub, already filtered to match your selected date range. For everything you can do there — searching, filtering, columns, and exporting — check out our View and Export Orders & Files guide.
Best Practices #
A little routine around this tab goes a long way toward keeping fulfillment predictable:
- Start your day with Overdue Orders. Checking this card first thing ensures the orders most at risk of frustrating a customer always get worked first, rather than whatever happens to be at the top of the list.
- Set your overdue threshold to match your real turnaround time. If you typically fulfill within 2 days, a default 3-day threshold will under-flag at-risk orders. Adjust it to reflect your actual fulfillment promise.
- Use Orders Needing Attention as your triage list, not just a count. Pair it with order tags for things like “Rush,” “Personalized,” or “Needs proof approval” so the orders that need a human decision don’t get buried in your regular queue.
- Watch Order to Fulfillment Time for drift. If the share of orders in your slowest bucket creeps up over a few weeks, that’s an early signal to revisit staffing, supplier lead times, or your customization workflow before it becomes a backlog.
- Compare Avg Fulfillment Time across date ranges. A steady or improving average suggests your process is holding up as volume grows; a rising average is worth investigating even if you’re not technically missing your overdue threshold yet.
Need Assistance? #
If you run into any issues with the Fulfillment Snapshot or it isn’t showing the data you expect, our support team is ready to help. Reach out anytime via the in-app live chat for prompt assistance.