Growing a store isn’t just about launching more products or running more promotions.
The stores that scale sustainably are the ones that measure what’s working, learn from real data, and improve with intention. They don’t guess. They decide with clarity.
That’s why Easify Box Builder Analytics exists.
Most tools help you build. Easify helps you build and grow — by giving you a clear way to measure impact, understand performance, and turn insights into real revenue. Analytics isn’t an extra feature here. It’s the growth compass inside Easify Box Builder.
Easify’s direction is simple: we grow with you.
When you sell more, increase order value, and scale with confidence — Easify is doing its job.
Why This Analytics Is Different (and Why It Matters) #
Most merchants can already see orders in Shopify.
But the real question is deeper:
How much of your growth comes from your boxes — and how strong is that impact?
Easify Advanced Analytics is built to answer this clearly, honestly, and actionably. It helps you:
- Identify which box is actually driving revenue (not just getting views)
- Understand whether your box strategy increases AOV or simply adds complexity
- Track growth trends over time — not just today’s snapshot
- Measure whether the app delivers positive returns compared to what you pay
This is what makes Easify Box Builder feel ahead.
It doesn’t stop at features. It gives merchants visibility and control, so growth becomes measurable, repeatable, and scalable.
Quick Access #
To access Growth Signals and Easify Advanced Analytics:
- Open the Easify Box Builder app in your Shopify admin.
- In the navigation bar, select Analytics.
- Click to open the dashboard and start exploring your growth metrics.
You’ll instantly see your performance overview and can begin measuring what drives your store’s growth.
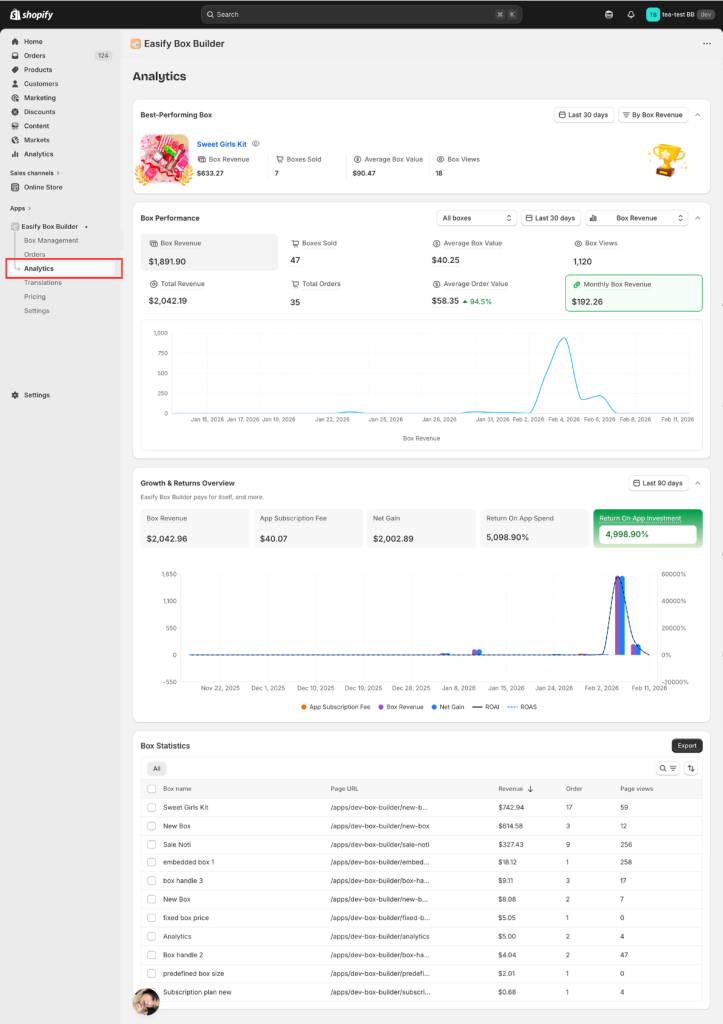
Analytics Overview #
Easify Advanced Analytics includes four key sections:
- Best-Performing Box – Identify what’s driving the most value right now.
- Box Performance – Track how boxes perform over time.
- Growth & Returns Overview – Measure revenue, net gain, and ROAI.
- Box Statistics – Validate insights with real order-level data.
Together, they help you understand, measure, and optimize your growth with confidence.
How to Read Your Growth Compass (Step by Step) #
1) Best-Performing Box #
Find the box that contributes the most to growth
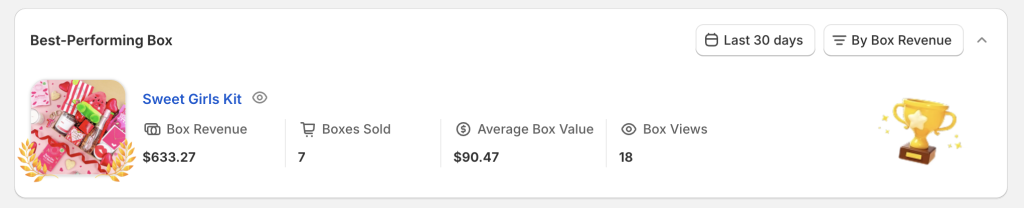
The Best-Performing Box section is designed to help you focus — not overwhelm you with rankings or long lists.
At any given time, this block displays one box only: the best-performing box based on the metric you choose.
The goal is to identify what works best right now, so you can improve it, replicate it, and plan your next sales move more effectively.
Metrics Explained #
Each metric highlights a different growth objective:
- Box Revenue
Shows the box that generates the highest revenue.
→ Best for identifying where money is actually coming from. - Boxes Sold
Shows the box that is purchased most frequently.
→ Best for understanding demand and customer preference. - Average Box Value
Shows the box with the highest average value per purchase.
→ Best for evaluating upsell strength. - Box Views
Shows the box with the highest visibility.
→ Best for analyzing exposure and top-of-funnel performance.
How It Works #
- You can filter performance by selecting a metric criterion.:
- Box Revenue
- Boxes Sold
- Average Box Value
- Box Views
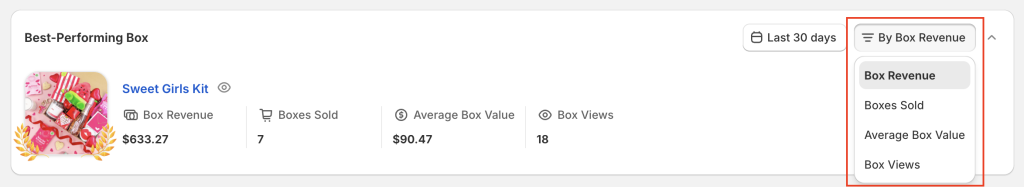
- Easify Analytics automatically identifies the single top -performing box for that criterion
- The result updates when:
- You change the selected metric
- You change the time period
This means the “best” box can change depending on:
- What you want to optimize
- Which period you are analyzing
And that’s intentional.
How to Read This Section #
Think of this block as a spotlight, not a leaderboard.
Each time you change the filter, ask:
- Which box is currently winning by this metric?
- Why is this box outperforming others?
- What can I improve or replicate from it?
A recommended reading flow:
- Start with Box Revenue → identify where real value is created
- Switch to Boxes Sold → understand customer demand
- Check Average Box Value → evaluate upsell effectiveness
- Review Box Views → assess visibility vs conversion
By switching metrics, you’re not comparing boxes —
you’re changing the question you’re asking about your business.
Tips for Insights & Optimization #
Use this section to guide action, not just observation:
- If the top box by Views is not the top box by Revenue
→ Improve conversion, pricing, or option clarity - If the top box by Average Box Value has low sales volume
→ Promote it more or use it for premium campaigns - If the same box consistently appears as the best performer
→ Treat it as your benchmark and reuse its structure - Use this insight to:
- Adjust product page layout
- Refine box options
- Plan promotions and bundles
- Optimize pricing strategy
Why This Matters #
Growth doesn’t come from trying to improve everything at once.
It comes from knowing where to focus.
The Best-Performing Box block helps you:
- Spot your strongest lever
- Improve it further
- Apply what works to the rest of your catalog
That’s how Easify helps merchants sell smarter, earn more, and plan growth with confidence — not by adding noise, but by showing exactly where to act next.
2) Box Performance (Charts) #
Understand how Easify boxes are actually performing over time
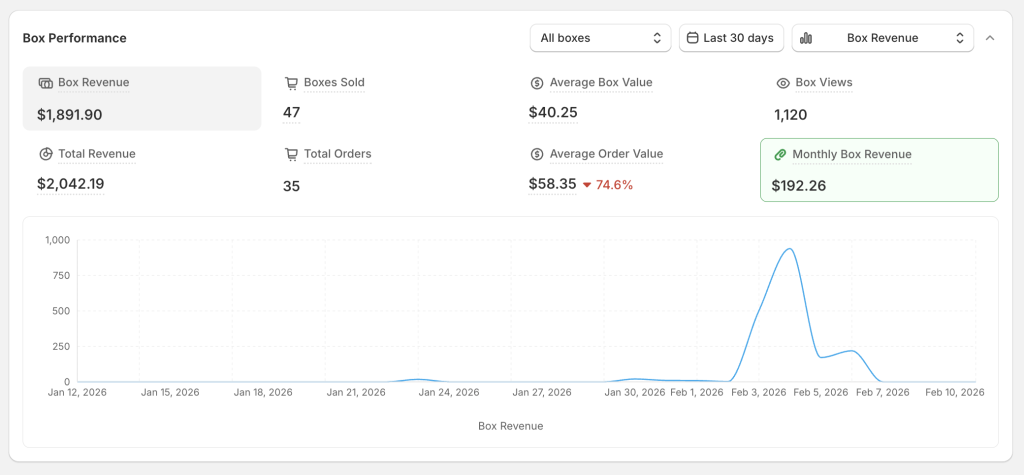
The Box Performance section helps you understand how well Easify boxes are working for your store, not just which box performs best.
Instead of focusing on a single moment or a single box, this section shows:
- How box-related metrics change over time
- Whether Easify boxes are becoming more effective or less effective
- How boxes contribute to overall store performance, not just box-level activity
Think of this section as your performance health check for Easify Box Builder.
Metrics Explained #
This section includes both box-level and store-level metrics, so you can see the full picture of impact.
- Box Revenue
Revenue generated directly from Easify boxes.
→ Shows how much value boxes are creating. - Boxes Sold
Number of boxes purchased.
→ Indicates customer adoption of box options. - Average Box Value
Average revenue generated per box.
Formula: Box Revenue ÷ Boxes Sold
→ Reflects upsell effectiveness per purchase. - Box Views
Number of times boxes are shown on product pages.
→ Indicates exposure and reach. - Total Revenue
Revenue from orders that include at least one Easify box.
→ Shows box impact at the order level. - Total Orders
Number of orders that include a box.
→ Indicates how often boxes influence purchases. - Average Order Value (AOV)
Average revenue per order that includes a box.
Formula: Total Revenue ÷ Total Orders
→ Shows whether boxes help customers spend more per order. - AOV Growth Rate
The percentage increase in store AOV compared to before using Easify.
→ Connects Easify boxes directly to store-level growth. - Monthly Box Revenue: Track revenue used for billing in the current cycle. This metric is not available during your 14-day free trial, as no billing is applied during that period.
How to Read This Section #
When reading Box Performance, focus on trends, not single numbers.
Ask yourself:
- Are box metrics improving over time?
- Are customers engaging more with box options?
- Is Easify helping increase order value — or just adding options?
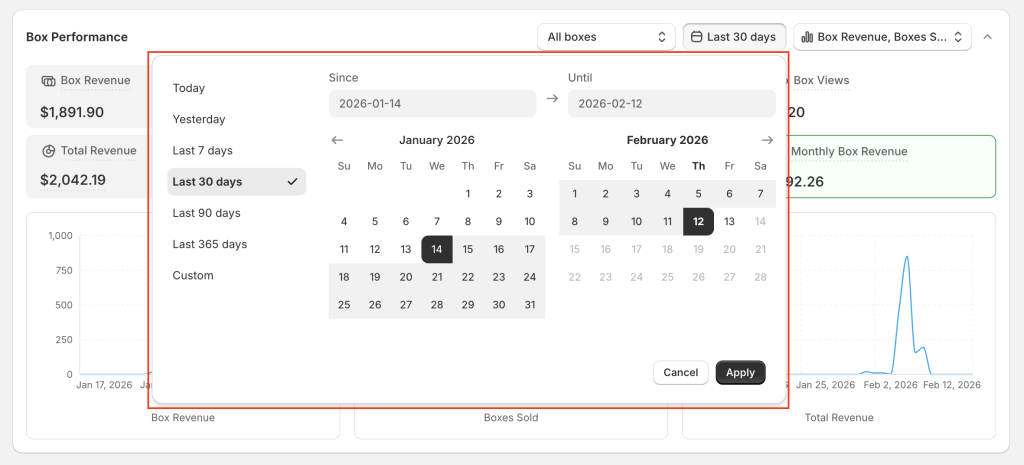
To keep your analysis focused, apply filters based on different criteria.
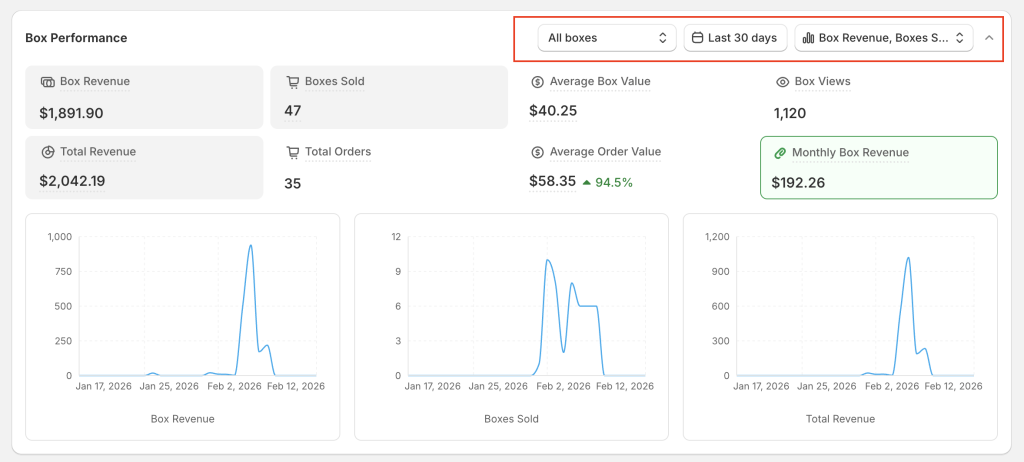
Click on any metric block to display its corresponding chart, or show multiple charts at the same time to compare trends.
You also can filter by time period to match your measurement goals.
Default chart view #
By default, the chart shows one metric at a time, keeping insights clear and easy to interpret.
This design helps you focus on what matters instead of scanning too much data at once.
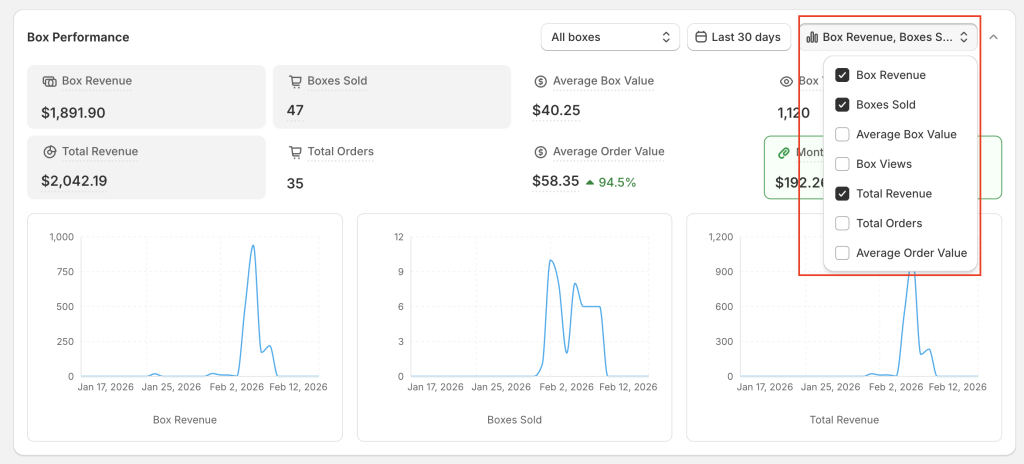
Customizing the chart (based on your goal) #
You are not limited to the default view.
- Click on the metric blocks to turn individual line charts on or off
- You can choose which metrics to display, depending on what you want to analyze
- Switch between metrics freely to explore different performance angles
This flexibility allows you to adapt the chart to your specific analysis purpose.
Tips for Insights & Optimization #
Use Box Performance to guide improvements, not just observation:
- Views increase but sales don’t
→ Improve clarity, simplify choices, or adjust pricing - Sales stay stable but average value rises
→ Upsell strategy is working — expand it to more products - Box revenue grows slower than total revenue
→ Boxes may need better positioning or stronger incentives - AOV growth rate improves
→ Easify boxes are contributing positively to overall store growth
Why This Section Matters #
Best-Performing Box tells you where to focus right now.
Box Performance tells you whether Easify is truly working over time.
Together, they help you:
- Measure real impact
- Adjust strategy with confidence
- Build a store that grows sustainably
That’s the purpose of Box Performance —
to help you understand how effective Easify Box Builder really is for your business.
3) Growth & Returns Overview #
See how Easify turns box activity into real revenue and profit
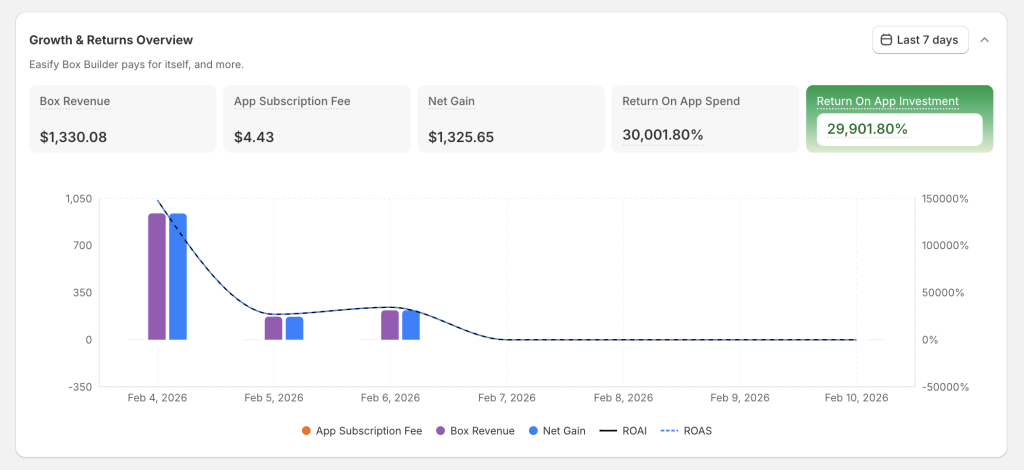
The Growth & Returns Overview section is where Easify proves its real value.
This block is not just about tracking numbers — it’s about showing how Easify helps you make money, not just use another paid app.
Here, you can clearly see:
- How much revenue Easify boxes generate
- How much you actually pay for the app
- How much value you keep after costs
- How efficiently Easify turns growth into profit
In short, this section answers one essential question:
Is Easify helping you earn more than it costs?
Metrics Explained #
- Box Revenue
The total revenue generated by Easify boxes within the selected time period.
This shows the money Easify helps bring into your store. - App Subscription Fee
The actual cost charged by Shopify for using Easify, calculated accurately based on your billing cycle and revenue tier. - Net Gain
The real profit generated by Easify after app costs.
Formula: Box Revenue − App Subscription Fee - ROAI (Return on App Investment)
Measures how efficiently Easify converts cost into profit.
Formula: (Net Gain ÷ App Subscription Fee) × 100
Together, these metrics tell a clear story:
Easify is either making you money — or showing you exactly how to improve until it does.
How It Works #
- Metrics update based on the selected time period
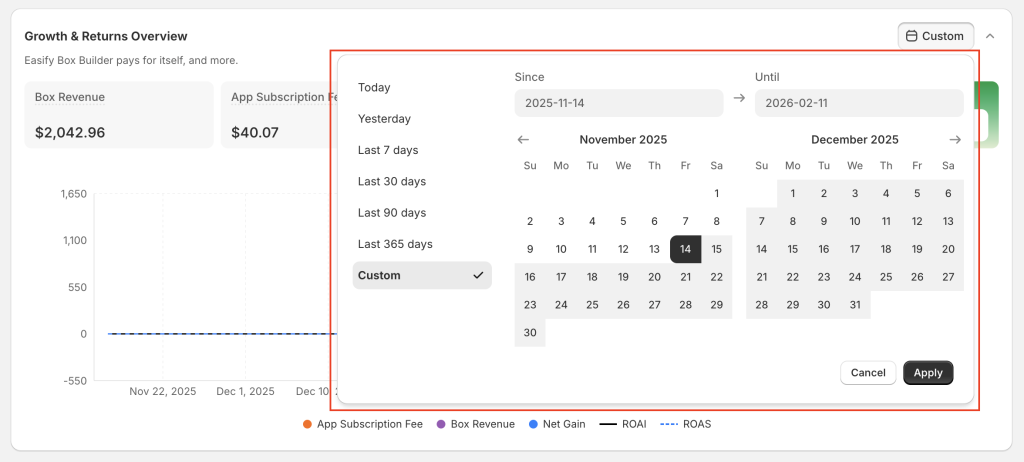
- Revenue and costs are aligned within the selected time period to ensure accurate comparisons.
- App fees are calculated according to your chosen time range (daily, monthly, or yearly)
- Line charts show how revenue, net gain, and ROAI change over time. Click any time milestone to see detailed metrics.
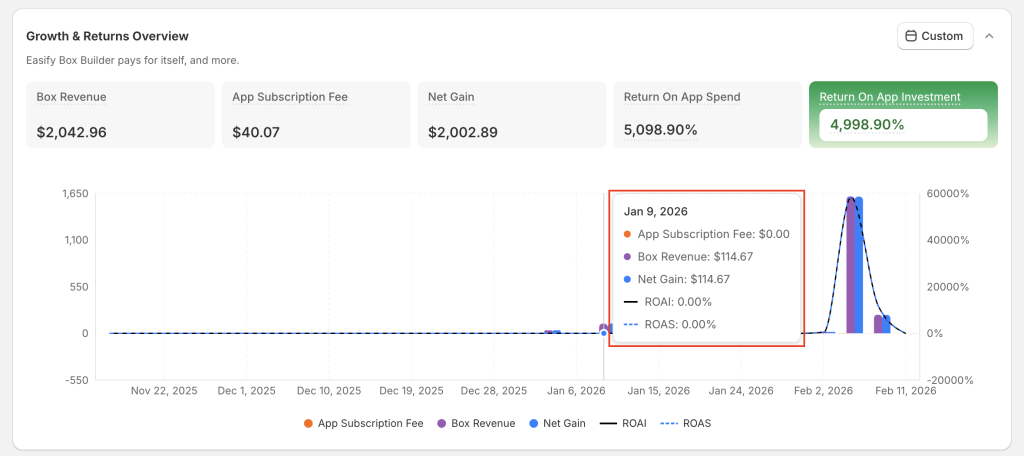
This ensures you’re not just seeing results — you’re understanding momentum.
How to Read This Section #
Read this block like a business dashboard, not a report.
- Start with Box Revenue
→ How much money Easify boxes are generating - Check Net Gain
→ How much of that revenue you actually keep - Look at ROAI
→ How efficiently Easify turns cost into profit
A healthy setup usually shows:
- Box Revenue growing over time
- Net Gain staying positive
- ROAI trending upward as boxes are optimized
Tips for Insights & Optimization #
- If ROAI is positive
→ Easify is already paying for itself. Focus on scaling what works. - If ROAI is low or negative
→ This often means:- Boxes are visible but not converting
- Pricing or options need refinement
- AOV lift hasn’t fully kicked in
Use insights from Best-Performing Box and Box Performance to improve ROAI over time.
Why This Section Matters #
Many apps ask merchants to trust them.
Easify shows you the proof.
The Growth & Returns Overview makes it clear that Easify Box Builder is:
- Not just a feature tool
- Not just a monthly cost
- But a revenue-generating growth engine
You don’t just see what Easify costs.
You see what Easify earns for your store.
4) Box Statistics #
Validate insights with real orders
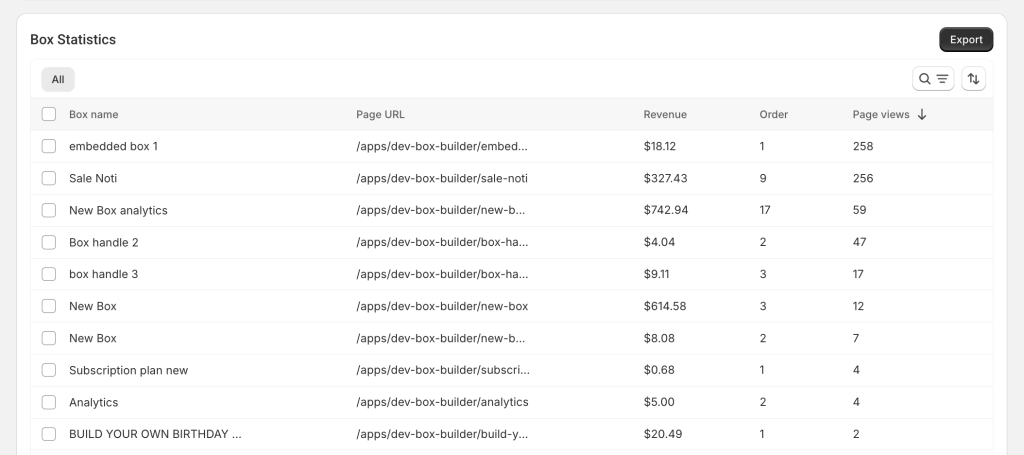
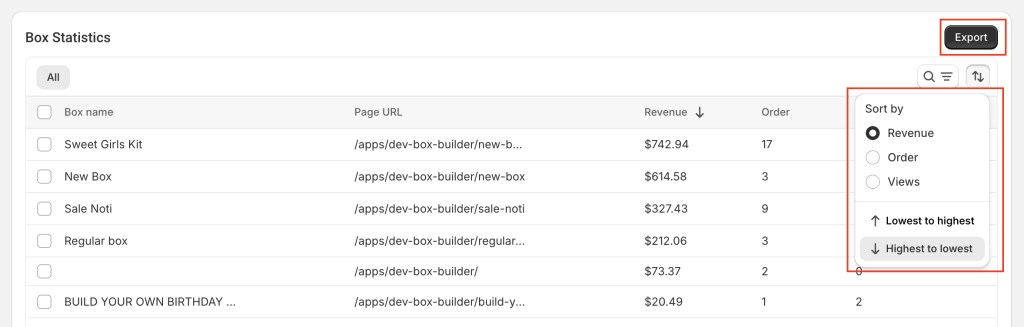
This table connects analytics to actual transactions. You can:
- See which boxes appear in high-value orders
- Confirm chart data with order-level details
- Export data for deeper analysis
Easify’s Principle: Grow First, Measure Always #
At Easify, we believe measurement is not a nice-to-have.
It’s what separates stores that guess from stores that scale.
That’s why Easify Box Builder is built to be more than a feature tool.
It’s designed to be a long-term growth partner, helping you move from assumptions to clarity, and from activity to real results.
Easify exists to support your growth at every step:
- Sell more through better box strategies
- Increase order value with meaningful options
- Understand why growth happens — not just that it happens
- Make confident, profitable decisions backed by real data
Because when you grow, you don’t just get more numbers on a dashboard.
You gain control over what works.
Confidence in the decisions you make.
And the freedom to scale without guesswork.
You now understand how Easify Advanced Analytics works — and how it turns data into clear growth signals.
Open the app and start measuring what truly drives your growth.
That’s how sustainable growth begins.
And that’s what Easify exists for.