Easify Product Options goes beyond just simplifying the creation of custom product options – it empowers you to track their performance in real-time and continuously optimize them to drive more sales. This feature is essential for any store looking to understand the direct and indirect impact of their product options, both priced and non-priced, on overall store success.
In this guide, we’ll introduce you to the Real-time Analytics feature, show you the valuable insights it provides, and explain how you can use this data to strengthen your product options and maximize your store’s revenue.
The analytics data is conveniently placed in several sections of the app: the Dashboard, the Your Option Sets page, and the Orders page. Each section provides different insights into how your product options are performing.
The Real-time Analytics is available on all plans.
However, users on the Free plan won’t have access to add-on features, meaning the related analytics for add-ons will be unavailable. Despite this, free plan users can still benefit from tracking how non-priced options impact total revenue and order numbers.
To unlock the full potential of the analytics and maximize your store’s performance, we recommend upgrading to a higher plan, which provides deeper insights into how both priced and non-priced options are boosting your revenue.
1. Analytics on the Dashboard #
What can you track?
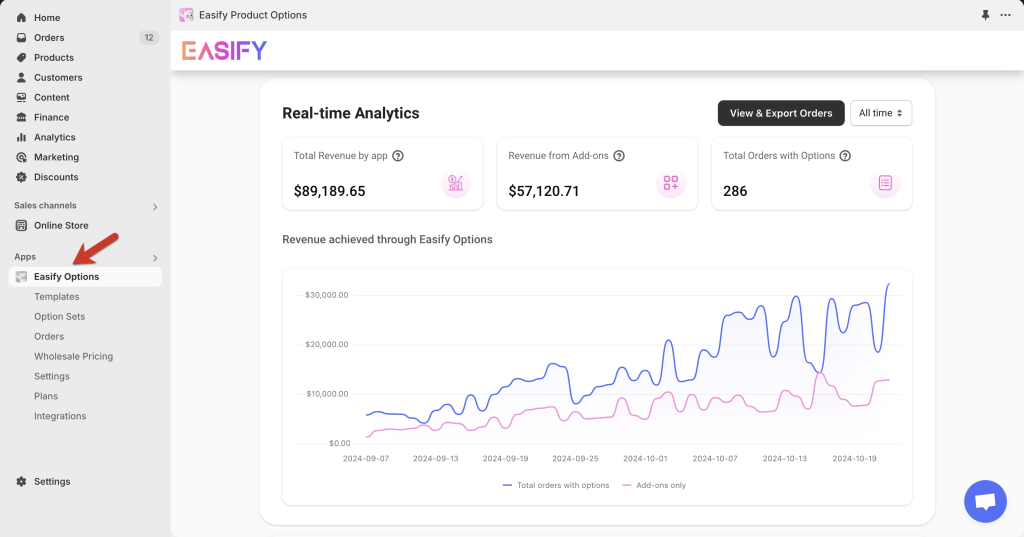
On the Dashboard, you’ll find a Real-time Analytics section, offering key performance indicators presented with a helpful line chart:
- Total Revenue by app: The total revenue from all orders that include Easify options, including both priced (add-ons) and non-priced options.
- Revenue from Add-ons: This metric focuses solely on the revenue generated from paid add-ons (options with an extra price).
- Total Orders with Options: The total number of orders that include Easify product options, whether priced or non-priced.
- Line Chart: You can view your revenue trends over various time periods – All time, 1 day, 7 days, 30 days, or a custom range. The chart displays:
- Blue Line: Revenue from all orders that include Easify options.
- Pink Line: Revenue generated specifically from paid add-on products.

How does this help?
This section gives you an at-a-glance overview of how much your product options are contributing to your store’s overall performance.
- Total Revenue by app: This metric reflects the overall contribution of your custom options to your store’s success. While non-priced options may not directly add to revenue, they enhance customer choice, which can lead to larger orders, improved customer satisfaction, and higher conversion rates.
- Revenue from Add-ons: This figure lets you track the specific contribution of your paid options. If this number is increasing, it’s a strong indication that your priced options are effectively driving higher order values.
- Total Orders with Options: A high count here shows that your custom options, whether free or paid, are adding value to the shopping experience. This suggests your customers find the customization options appealing, which may lead to more completed purchases.
By analyzing these metrics, you can:
- Assess the Impact of Product Options: Comparing total revenue with revenue from add-ons allows you to evaluate how much of your income is driven by paid options. If add-ons contribute significantly to your sales, you may want to focus more on creating attractive add-on options to boost profitability.
- Identify Key Sales Periods: By adjusting the time range, you can pinpoint specific time periods where sales surged or dipped. This can be useful for identifying the impact of marketing campaigns, seasonal trends, or product launches. You can then align future promotions to capitalize on these insights.
- Optimize Your Product Strategy: Tracking the number of orders that include options shows whether your customization offerings resonate with customers. If a significant percentage of orders involve custom options, it’s a strong signal that expanding or enhancing these options could further drive sales and customer loyalty.
- Monitor Revenue Trends: The line chart gives a clear visual of your revenue trends over time. Spotting consistent upward or downward patterns can help you identify successful strategies or highlight areas for improvement, whether it’s related to specific options, promotions, or time-sensitive sales activities.
Pro Tip:
To understand whether your custom options are boosting revenue and order numbers, compare your current performance with a previous period before these options were added.
Alternatively, you can compare the revenue and order number from orders with options against your total revenue or analyze orders with options versus those without. This will give you a clear picture of how effective your product options are.
2. Analytics on the Your Option Sets page #
What can you track?
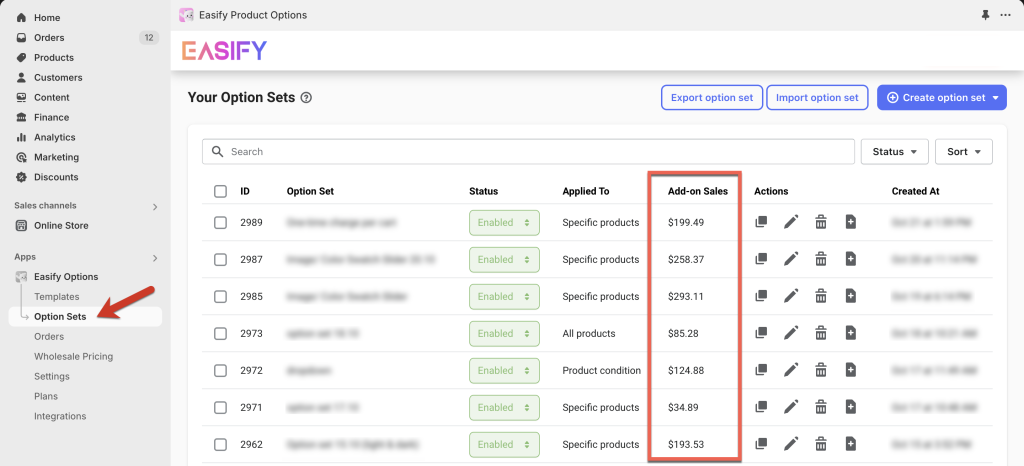
On the Your Option Sets page, you’ll see an Add-on Sales column, showing the total revenue generated by add-ons (paid options) for each option set.

How does this help?
The data on this page allows you to evaluate and compare the financial performance of your individual option sets. Here’s how this information is valuable:
- Compare Option Set Performance: By reviewing the add-on sales for each set, you can quickly identify which sets are generating the most revenue. This helps you understand what types of customization or add-ons are most appealing to your customers. For underperforming sets, you can consider redesigning or promoting them more effectively.
- Spot High-Performing Products: Option sets that drive high add-on sales may indicate products or product categories that have a high potential for customization. You could leverage this insight to further develop those product ranges, introducing new options or expanding existing ones to capitalize on customer interest.
- Refine Your Offering: If certain option sets are not performing well, it could be an indicator that the add-ons or customizations offered aren’t compelling enough. You might test different pricing strategies, redesign the options, or introduce more value-driven add-ons to boost their appeal.
- Tailor Marketing Campaigns: Knowing which option sets generate the most revenue allows you to target your marketing efforts. You can promote these successful option sets in email campaigns or social media ads, helping drive even more sales.
3. Analytics on the Orders page #
What can you track?
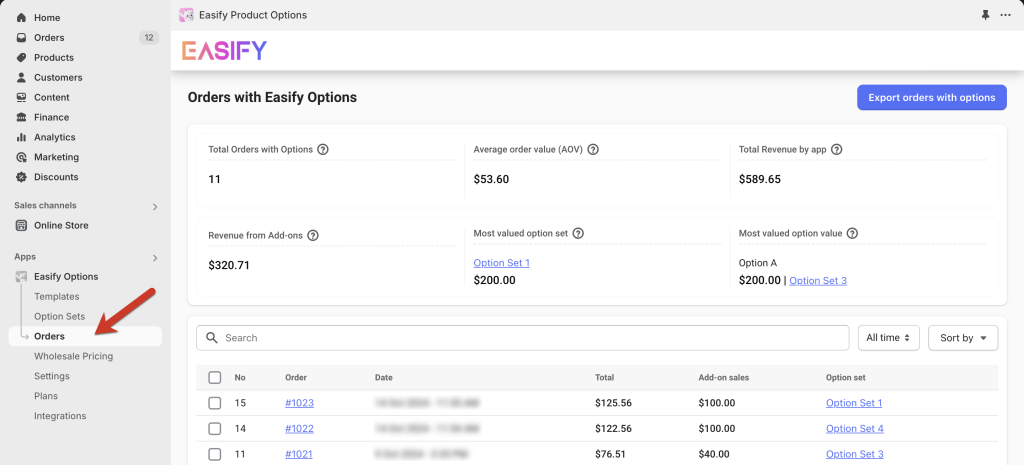
The Orders page provides additional useful statistics, some of which are also available on the Dashboard, but with extra insights:
- Total Orders with Options: Same as on the Dashboard, this shows how many orders include Easify product options.
- Total Revenue from Easify Options: Also similar to the Dashboard, this tracks revenue from all orders with options.
- Revenue from Add-ons: Again, similar to the Dashboard, this shows revenue from paid add-on options.
- Average Order Value (AOV): The average value of all orders that include Easify options.
- Most Valuable Option Set: The option set that has generated the highest total revenue for your store. You can also see the total revenue for this option set.
- Most Valuable Option Value: The individual option value that has brought in the most revenue. This includes details about which Option Set this option value belongs to, as well as the total revenue it has generated.

How does this help?
The data on the Orders page provides even deeper insights into how your options contribute to your store’s revenue. Here’s how you can benefit:
- Understand the Financial Impact of Options: Tracking how many orders include product options helps you see the tangible value of offering customization. If a high percentage of orders include options, it’s a sign that customers value customization, which could encourage you to expand this aspect of your store.
- Boost Revenue with Add-ons: The Revenue from Add-ons stat helps you see exactly how much money add-ons are bringing in. If this figure is low, it may suggest that your add-ons aren’t compelling enough, or perhaps they’re priced too high. You can experiment with different pricing or offer promotions to increase add-on sales.
- Measure the Effectiveness of Options: By analyzing the Average Order Value, you can see if orders that include Easify options are typically higher than those without. If so, you’re already using product options to effectively increase the value of each sale.
- Identify Your Top Performers: The Most Valued Option Set and Most Valued Option Value stats provide direct insights into which options and sets are driving the most revenue. This helps you understand what your customers want most. You can use this knowledge to optimize the performance of your other options, replicate the success of the top performers, and drive more revenue.
- Fine-tune Product Offerings: If a particular option or set consistently outperforms others, it’s a strong indication that this customization resonates with your customers. You can double down on promoting these popular choices, perhaps even designing related products or services around them.
Need Assistance? #
If you have any questions about navigating the analytics or need help understanding how to use this data to grow your store, don’t hesitate to reach out! Our support team is available via the in-app live chat to assist you.